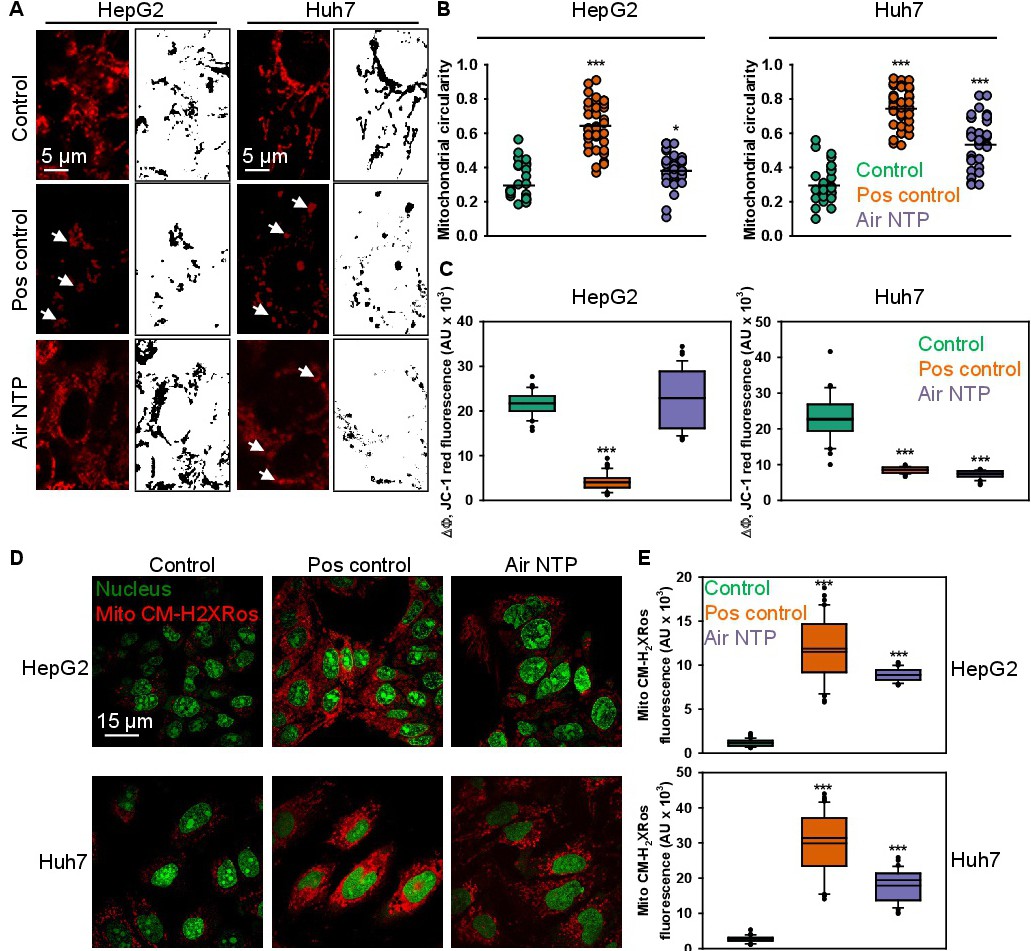
Fig. 4. Alteration of mitochondrial dynamics and induction of mitochondrial membrane depolarization by NTP treatment. (A) Confocal imaging with binarized pictures of the original images shows mitochondrial fragmentation in Huh7 cells treated with NTP for controls stained with JC-1 (1 µM). Cells were treated with NTP for 60 s and stained 5 h post plasma treatment. Positive control - 20 % ethanol for 20 min. Arrows indicate swollen mitochondrial phenotype. (B) Pre-processed images of mitochondria stained with JC-1 as described in (A) were subjected to morphometric analysis for mitochondrial circularity. Morphometric analysis was performed using ImageJ (NIH). The data expressed as mean of n = 30-50 cells; *P< 0.05, ***P< 0.001. (C) Confocal images of mitochondria stained with JC-1 as described in (A) were quantified for total red JC-1 fluorescence. The red fluorescence intensity of JC-1 reflects the level of ΔmΦ. Quantifications performed using ImageJ (NIH) are presented as means of n = 30-50 cells; ***P< 0.001. (D) Representative confocal analysis of ROS production in HCC cell lines preloaded with the mitochondrial-ROS-sensitive probe MitoTracker(r) red CM-H2XRos under conditions of NTP treatment. Cells were treated with NTP for 60 s and stained 5 h post plasma treatment. Non-irradiated cells treated with pyocyanin (200 µM) were used as a ROS positive control. For nuclear staining SYTO 13 (green dye) was used. (E) Quantitative imaging analysis of NTP-induced mitochondrial ROS detected by MitoTracker(r) red CM-H2XRos. Confocal images of mitochondria stained as described in (D) were subjected to fluorescence intensity quantification performed using ImageJ (NIH). The data expressed as mean of n = 30-50 cells; ***P< 0.001.